|
SciSDK Library
SDK for SciCompiler projects
|
|
SciSDK Library
SDK for SciCompiler projects
|
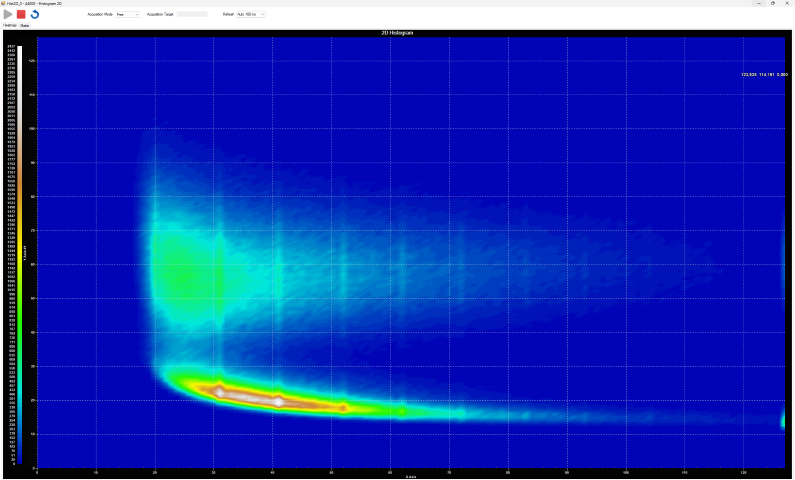
The 2D histogram is a matrix organized in rows and columns and allows to count the number of events in a two-dimensional space. The typical application is to accumulate in FPGA a multi-parameters analysis like a Pulse Shape vs Energy (PSD), time of flight vs energy, or rise time vs energy. The histogram is a configurable size memory managed by the IP core in the fpga. The spectrum core increment the bin of the histogram specified by the x and y values of the event.
The FPGA elements has the following inputs:
x: a 16 bit value representing the x position of the event in the 2D matrixy: a 16 bit value representing the y position of the event in the 2D matrixdv: a trigger that validate the event and increment the bin of the histogramAn energy spectrum has the following parameters taken from the JSON file:
Number of bins and number of bits define the memory occupancy of the spectrum indeed they are defined at compile time by SciCompiler.
The following parameters can be configured:
| Parameter | Acces Mode | Description | Default value |
|---|---|---|---|
| limitmode | R/W | spectrum integration limit target: freerun, time_ms, total_count, peak_count | freerun |
| limit | R/W | target value when limit mode is set to: time_ms, total_count, peak_count | 0 |
| binsX | R | number of bins of the histogram X | |
| binsY | R | number of bins of the histogram Y | |
| max_conts | R | maximum number of counts y-axes on the histogram | |
| buffer_type | R | type of the buffer: (always decoded) |
The limit mode is used to set the integration time of the spectrum. The limit mode can be set to:
Limit must be congirured accordingly to the limit mode. The limit mode is set by the parameter limitmode. The limit is set by the parameter limit. limit parameter is a 32 bit in value value. The limit is expressed in milliseconds for time_ms mode, in counts for total_count and peak_count mode. In order to use the limit, the two parameters limitmode and limit must be set before the spectrum is started.
The correct procedure to set (for example) the time limit is:
limitmode to time_mslimit to the desired value (ie 10000 for 10 seconds)start commandDuring the running phase it is possible to:
stop command (abort)reset_counters commandThe following commands are available:
| Command | Description | Parameter |
|---|---|---|
| start | start the spectrum integration | |
| stop | suspend the spectrum integration | |
| reset | reinitialize all bins in the histogram to 0 | |
| reset_counters | reset all limit counters and statistics counters in order to restart limits |
start and stop commands do not reset the spectrum. They should be consideder as a start and pause of the spectrum. A start command after a stop command will continue the integration from the last bin value. In order to reset the spectrum it is necessary to use the reset command. The reset command reset all the bins in the histogram to 0. The reset command is useful to restart the spectrum from scratch. reset command execute also the reset_counters command.
This command is useful to reset all limit counters and statistics counters in order to restart limits. This command is executed by reset command implicitally. When this command is executed the progress in the status is also reset to 0.
Spectrum component support only decoded output data format.
The data output structure is the following:
The magic field is a 32 bit value that identify the data format. The data field is a pointer to the data buffer. The data buffer is an array of 32 bit values. The number of elements in the array is defined by the total_bins field. The valid_bins field is the number of bins that contains data. The valid_bins field is always less or equal to total_bins field.
timecode it's the epoch of the readout PC when the data is readout from the fpga. The timecode is expressed in milliseconds.
Data in the data array are the counts of each bin. The first element of the array is the bin in position X0 Y0. The last element of the array is the bin with the X_MAX Y_MAX. Each element of the array is a 32 bit value.
For example for a 2d histogram with 128 bins on X and 64 bins on Y the data format is the following:
| Data Format |
|---|
| X0, Y0 |
| X1, Y0 |
| ... |
| X127, Y0 |
| X0, Y1 |
| X1, Y1 |
| ... |
| X0, Y63 |
| ... |
| X127, Y63 |
The status of the spectrum is stored in a SCISDK_SPECTRUM_STATUS structure.
The running field is true if the spectrum is running. The completed field is true if the spectrum run is completed. This field has meaning only if the spectrum limitmode is:
total_countpeak_counttime_mscompleted is false until the internal limit counter do no reach the limit value.
The progress field is the progress of the spectrum integration in respect of the value of limit. The progress is expressed in percentage.
The peak_max field is the value of the bin with the highest count.
The total_counter field is the total number of counts in the histogram.
The integration_time field is the integration time of the spectrum in milliseconds.
The current version of the library do not report the peak_max, total_counter, integration_time fields. These fields are always 0.
The following example shows how to use the spectrum component.